
Find the mode, the most frequent value in any list of numbers. Detects unimodal, bimodal, and multimodal data sets, with a full frequency table.
| Quantity | Value | Formula | Notes |
|---|
| Value | Frequency | Percentage | Note |
|---|
| Metric | Value | Notes |
|---|
-
Select a citation style above. Click the citation text to select it all, then copy.
ADVERTISEMENT

Founder & CEO, Toolraxy
Faiq Ur Rahman is a web designer, digital product developer, and founder of Toolraxy, a growing platform of web-based calculators and utility tools. He specializes in building structured, user-friendly tools focused on health, finance, productivity, and everyday problem-solving.
User Ratings:
ADVERTISEMENT
ADVERTISEMENT
The mode is the value that appears most frequently in a data set. If one value repeats more than any other, it’s the mode. If two or more values tie for the highest count, each one is a mode. If every value appears the same number of times, the data set has no mode. The National Cancer Institute’s thesaurus defines it the same way: the value that occurs most often, with ties counted as multiple modes and no repetition meaning no mode.
Statisticians treat the mode differently from the mean and median. It’s the only measure of center that works on nominal data categories like eye color, car model, or blood type where averaging and ordering make no sense. The Australian Bureau of Statistics notes that for nominal variables the mode is the only useful measure of central tendency, because the mean and median require numbers that can be added or ranked. For discrete numeric data like shoe sizes or household size, the mode tells you the most common value directly. The trade-off is instability: the mode can jump when one value is added, and with continuous data like exact heights or temperatures, repeated values are rare, so the mode often doesn’t exist. If you’re working with continuous values and need a center, the median calculator handles the middle-position calculation without requiring repeated values.
List the values, count how many times each one appears, and pick the value with the highest count. If two or more values tie for the highest count, report all of them. If every value appears exactly once, there’s no mode. The calculator does the counting for you.
Paste or type your numbers into the data set box. Commas, spaces, semicolons, and new lines all separate values.
Check the “Values detected” field against the count you expected. A mismatched count usually means a stray character or a missing separator.
Set the decimal places for the display, from zero to six. The default is two.
Read the mode from the large result at the top. If there’s no mode, the result says “No mode” instead of a number.
Open the frequency table to see every distinct value, how many times it appeared, and what percentage of the data set it represents. The mode row is highlighted.
Check the “Type of mode” tile or the context line to confirm whether the data is unimodal, bimodal, multimodal, or has no mode.
The mode formula isn’t a calculation in the arithmetic sense. It’s a counting rule: build a frequency for every distinct value, find the maximum frequency, and return every value that reaches it. In notation, the mode is the value xx where f(x)f(x) reaches its maximum.
IQR-style note: If max frequency = 1, the data set has no mode.
The calculator sorts the values, counts them into a frequency map, finds the highest count, and then collects every value whose count equals that maximum. The mean and median are computed separately and shown for reference, but they don’t influence the mode. The NCBI StatPearls entry on mode describes the same process: count the frequency of each result, and the result with the highest count is the mode. If multiple results tie, each is a mode.
A shoe shop sells 20 pairs in a day. The sizes are 7, 8, 7, 9, 10, 8, 7, 7, 6, 8, 7, 9, 7, 10, 8, 7, 6, 7, 9, 8. The frequency table shows size 6 appears twice, size 7 appears eight times, size 8 appears five times, size 9 appears three times, and size 10 appears twice. The highest frequency is eight, so the mode is size 7.
Size 7 accounts for 8 out of 20 pairs, or 40% of the day’s sales. The mean size comes out to 7.7, which doesn’t correspond to any actual shoe size sold. The median sits between size 7 and size 8, giving 7.5 also not a stocked size in most cases. That gap is the practical argument for the mode: the shop should reorder size 7 first because it’s the most common purchase, not because it’s the average or the middle. The range runs from 6 to 10, a spread of four sizes.
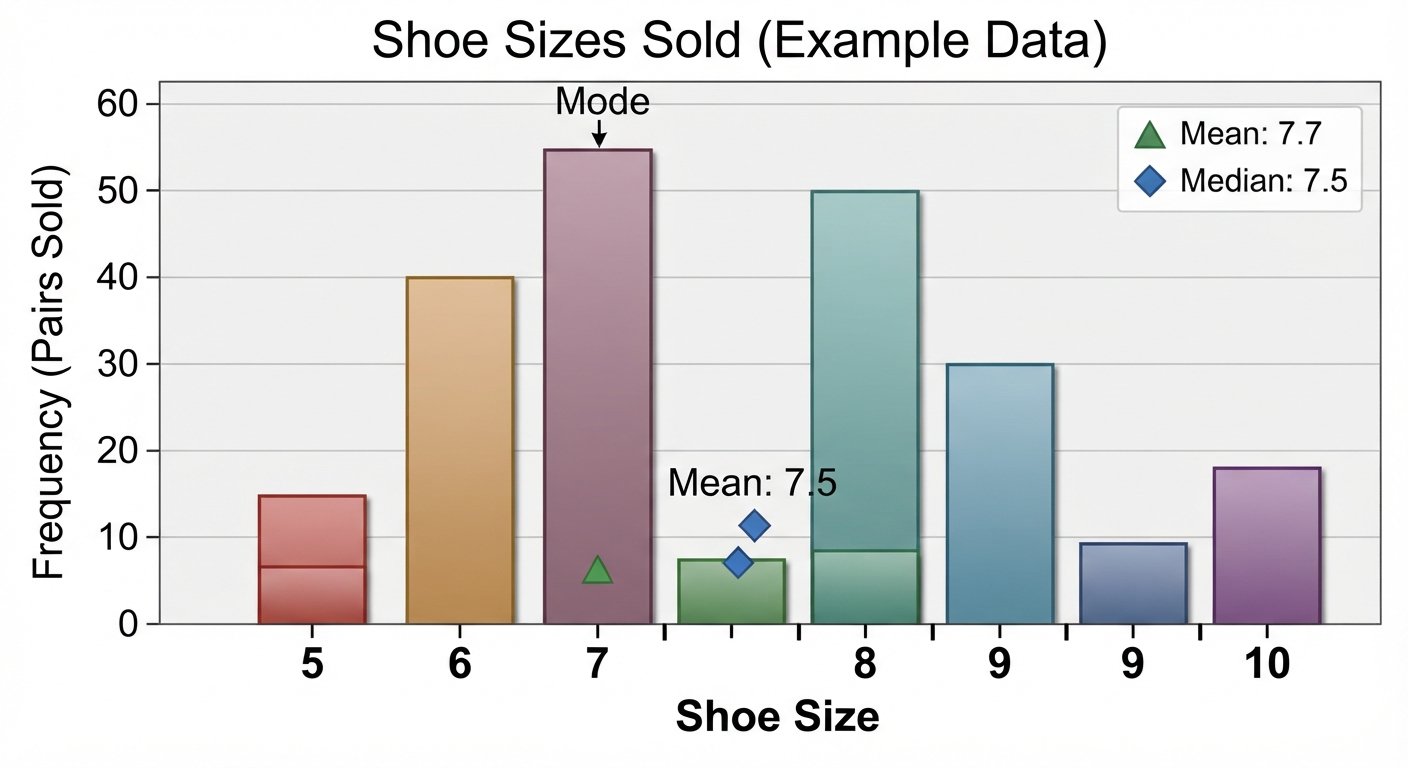
This table shows a typical daily sales pattern for a shoe shop. The values are illustrative of the kind of discrete data where the mode is the right measure, not outputs from the calculator.
| Shoe size | Pairs sold and what it suggests |
|---|---|
| 6 | 2 pairs, 10% of sales, low-stock size |
| 7 | 8 pairs, 40% of sales, the mode, reorder first |
| 8 | 5 pairs, 25% of sales, second priority |
| 9 | 3 pairs, 15% of sales, steady but not dominant |
| 10 | 2 pairs, 10% of sales, low-stock size |
The mode is size 7 at eight pairs, or 40% of the day’s sales. The percentages come from dividing each frequency by the total count of 20. If you need to convert a sales percentage to a proportion or fraction for an order sheet, a percentage calculator handles that conversion. The mean size of 7.7 and median of 7.5 both fall between stocked sizes, which is why inventory decisions lean on the mode instead.
The mode is the most frequent value; the mean is the sum divided by the count. The mode works on labels and categories where the mean can’t operate, while the mean uses every value and works best when the data is symmetric and numeric.
| Dimension | Mode vs mean |
|---|---|
| What it measures | Mode: the most common value. Mean: the arithmetic center of all values. |
| Data types | Mode works on nominal, ordinal, and discrete numeric data; mean requires numeric data. |
| Outlier effect | Mode is relatively immune to outliers; mean is pulled toward them. |
| Stability | Mode can jump when one value is added; mean changes smoothly with every value. |
| Multiple answers | Mode can return several values; mean returns exactly one. |
| Best use case | Mode: inventory, categories, survey responses. Mean: symmetric numeric data like test scores. |
The mode wins when the question is “what’s the most common?” A shoe shop, a restaurant menu, or a survey asking for the most popular answer needs the mode. The mean wins when every value should count and the data is roughly symmetric. The Europe PMC review of central tendency measures puts it plainly: the mode is a good descriptive statistic for nominal data but of little other use, while the mean and median provide a single summary for quantitative data. If you need a single center for continuous numeric data and the distribution is skewed, the median is usually the safer choice.
The mode is the value that appears most often in a data set. If one value repeats more than any other, it’s the mode. If two or more tie, each is a mode. If nothing repeats, there’s no mode.
Count how many times each distinct value appears, then pick the value with the highest count. The calculator builds the frequency table for you and highlights the mode row.
The mode is the most frequent value; the mean is the sum divided by the count. The mode works on categories where the mean can’t, while the mean uses every numeric value and gives a single arithmetic center.
No. “Average” usually means the mean. The mode is a different measure of center that reports the most common value, not the arithmetic center.
Yes. If two or more values tie for the highest frequency, each one is a mode. Two modes is bimodal; three or more is multimodal.
Every value appears the same number of times. In most cases that means every value appears exactly once, which is common with continuous measurements like exact heights or temperatures.
Use the mode when the data is categorical or when you need the most common value. Shoe sizes, survey responses, and inventory counts are typical cases. Use the mean or median for symmetric numeric data where every value should count.
Yes. Negative values are parsed and counted like any other number, and the mode can be negative if the most frequent value is below zero.
A distribution with two distinct peaks or two most frequent values. Human height separated by sex is the classic example: one peak for men, one for women, when both groups are combined into one data set.
Yes. If the most frequent value in the data set is a decimal like 3.75, that’s the mode. The calculator reports it at the decimal places you choose.
The median is the middle value after sorting; the mode is the most frequent value before sorting. The median always returns one value; the mode can return several or none.
Yes. The frequency table includes a percentage column showing each value’s share of the total count, so you can see how dominant the mode is relative to the rest of the data.
The National Cancer Institute’s thesaurus entry on mode defines the mode as the most frequently occurring value, with ties counted as multiple modes and no repetition meaning no mode.
The Australian Bureau of Statistics guidance on measures of location explains that the mode is the only useful measure of center for nominal variables and gives worked examples with count data.
The NCBI Bookshelf StatPearls entry on mode describes the counting method for the mode and notes that a data set has no mode when all values appear only once.
The Europe PMC review of mean, median, and mode explains when each measure is appropriate and notes that the mode is best suited to nominal data and bimodal distributions.
Median calculator – runs the sorted-middle calculation so you can compare it with the mean.
Arithmetic mean calculator – computes the sum-divided-by-count average when every value should count equally.
This calculator is an educational and utility tool. It performs the mode and frequency-count calculations described on this page, but it does not provide statistical consulting, financial advice, medical advice, or any other professional service. If you’re using a mode to make a decision that carries financial, health, or safety consequences, confirm the result with a qualified professional who can review the data and its interpretation.
ADVERTISEMENT
ADVERTISEMENT