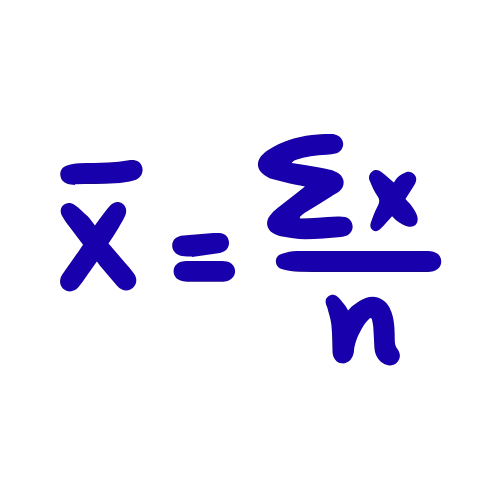

Find the arithmetic mean (average) of any list of numbers, along with the sum, count, median, range, and a complete step-by-step breakdown.
| Quantity | Value | Formula | Notes |
|---|
| # | Value (x) | Running total (Σx) | Deviation (x − x̄) |
|---|
| Metric | Value | Notes |
|---|
-
Select a citation style above. Click the citation text to select it all, then copy.
ADVERTISEMENT

Founder & CEO, Toolraxy
Faiq Ur Rahman is a web designer, digital product developer, and founder of Toolraxy, a growing platform of web-based calculators and utility tools. He specializes in building structured, user-friendly tools focused on health, finance, productivity, and everyday problem-solving.
User Ratings:
ADVERTISEMENT
ADVERTISEMENT
The arithmetic mean is the sum of a set of values divided by how many values there are. Statisticians call it the “mean,” most people call it the “average,” and the Britannica entry on mean, median, and mode defines it the same way: add the numbers, divide by the count.
The arithmetic mean sits at the center of descriptive statistics alongside the median and the mode. It’s the measure most people reach for first because it uses every value in the data set. A single extreme number pulls the mean toward it, though, which is why income reports often lead with the median instead. The mean is still the right tool for test scores, temperatures, measurement averages, and anything else where every observation should count equally. Just know that “average” in everyday speech almost always means this specific calculation, not a median or a mode. If you’re checking a result against a middle value, the median calculator runs the sorted-middle calculation separately so you can compare the two side by side.
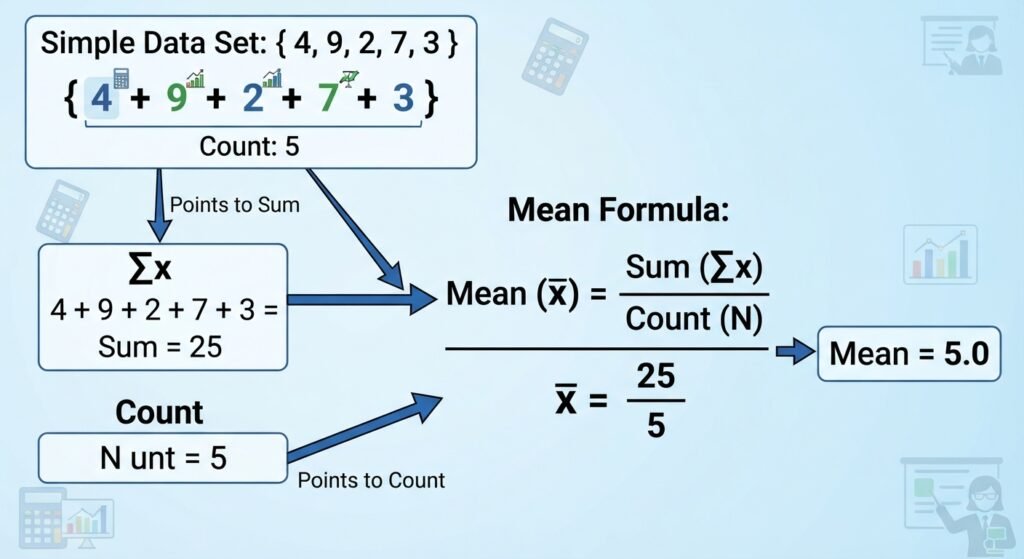
Add every number in the list together, then divide that total by how many numbers you added. That’s the whole method. The calculator does the arithmetic, but here’s the input order if you want to follow along.
Paste or type your numbers into the data set box. Commas, spaces, semicolons, and new lines all work as separators.
Check the “Values detected” field to confirm the count. If a value looks missing, scan the list for a stray letter or a double comma that broke a number into two pieces.
Set the decimal places you want in the results, anywhere from zero to six. The default is two.
Read the arithmetic mean from the large result at the top of the results panel.
Scroll to the step-by-step table if you want to see the running total after each value. The deviation column shows how far each number sits from the mean.
Use the breakdown table for the sum, count, and the sum of deviations, which should land at or near zero for a correct mean.
The arithmetic mean formula is the sum of all values divided by the number of values. Write it as x̄ = Σx ÷ n, where Σx is the total of every number in the list and n is the count.
On a whiteboard you’d write each value in a column, add the column, and divide by how many entries you wrote down. The calculator does the same thing in code. It splits your input on whitespace, commas, and semicolons, converts each token to a number, throws out anything that isn’t finite, adds the survivors, and divides by how many survived. The mean uses full precision for every downstream calculation. Only the display gets rounded.
Suppose eight students took a quiz and scored 72, 85, 91, 68, 79, 94, 88, and 83. The sum is 660 and the count is 8, so the arithmetic mean is 660 ÷ 8 = 82.5.
Here’s the running total the calculator builds as it reads left to right: 72, then 157, then 248, then 316, then 395, then 489, then 577, then 660. Divide 660 by 8 and you get 82.5. The median of the sorted scores (68, 72, 79, 83, 85, 88, 91, 94) is the average of 83 and 85, which is 84. The mean sits slightly below the median because the 68 pulls it down. The range runs from 68 to 94, a spread of 26 points. If you want to see how far each score sits from the mean, the deviation column in the step-by-step table shows that 72 is −10.5 below the mean while 94 is +11.5 above it. Adding all eight deviations gives zero, which confirms the mean is correctly calculated.
That 82.5 is a useful summary, but it doesn’t tell you whether the scores are tightly clustered or spread wide.
The arithmetic mean adds every value and divides by the count; the median sorts the values and picks the middle one. The mean uses all the data, so an outlier pulls it. The median ignores how far the extremes sit from the center, so one huge value doesn’t move it.
| Dimension | Arithmetic mean vs median |
|---|---|
| Calculation | Mean: sum all values, divide by n. Median: sort values, pick the middle (or average the two middles). |
| Sensitivity to outliers | Mean moves toward an extreme value; median stays near the center. |
| Best for symmetric data | Both work; they land close together when the distribution is balanced. |
| Best for skewed data | Median wins for income, home prices, and anything with a long tail; mean still gets reported but needs a caveat. |
| Uses every value | Mean does; median only uses the middle position. |
| Small data sets | Mean is easy to distort with one entry; median is more stable but less informative about the rest of the values. |
| What the calculator reports | Both; the mean is the headline result and the median appears in the supporting tiles and summary table. |
The mean wins when every value should count equally and the data doesn’t have a wild tail. Test scores, temperature readings, and measurement averages are mean territory. The median wins when a few extreme values would mislead. If you’re summarizing household incomes in a city with a handful of billionaires, the mean will overstate what a typical household earns. The median tells you where the 50th percentile sits.
The mean moves when the total moves or when the count changes. That sounds obvious, but the practical drivers are more specific: an outlier, a parsing error that drops a value, or a count that includes a zero you didn’t notice.
Extreme values pull the mean toward them. A single 200 in a list of scores between 60 and 90 drags the average upward, sometimes by several points.
The count includes every accepted value. A zero counts as a value. If you forget to remove a placeholder zero, the mean drops.
Parsing errors change the count. A token like “12a” gets rejected, which lowers n and changes the divisor. Check the “Values detected” field against your expected count.
Decimal places affect the display, not the calculation. The tool computes at full precision and rounds only what you see. A mean displayed as 82.50 and one displayed as 82.5 are the same number underneath.
Negative values are valid. Temperatures below zero and financial losses belong in the list. They pull the mean down just like any other value below the current average.
The mean of a subset is not the mean of the whole. If you calculate averages for two groups separately and then average those two averages, you’ll get a different number than if you pooled every value. That’s the classic averaging-averages mistake.
Data set size changes stability. A mean from five values can swing hard when one value changes. A mean from five hundred values barely moves.
The arithmetic mean is the sum of a list of numbers divided by how many numbers are in the list. For 4, 8, and 12, the sum is 24 and the count is 3, so the mean is 8.
Add every value together, then divide by the count. The calculator does this automatically when you paste a list. You can watch the running total build in the step-by-step table.
The mean uses every value and can be pulled by an extreme number. The median sorts the values and picks the middle one, so one huge outlier doesn’t move it. Income reports often use the median for that reason.
In everyday language, yes. “Average” usually means the arithmetic mean. In statistics, “average” can also refer to the median or the mode, so the word alone isn’t precise.
Your data is probably skewed. If a few large values are pulling the mean upward, the mean will sit above the median. If a few small values are pulling it down, the mean will sit below the median. The gap is a clue about the shape of the distribution.
Yes. If the values sum to a negative number, the mean is negative. Temperature data below freezing and financial losses are common cases.
The parser splits on whitespace, commas, and semicolons, then converts each token to a number. Tokens that don’t convert are ignored. The verdict line tells you how many entries were skipped.
Two decimal places covers most everyday uses like test scores and temperatures. Use more when the values themselves have several decimal places or when a small difference matters.
Use the median when the data has extreme values or a long tail. Income, home prices, and wait times are common examples. The mean still gets reported, but the median better represents the typical case.
A weighted average gives some values more influence than others. The arithmetic mean treats every value equally. GPA is a weighted average because a 4-credit course counts more than a 2-credit course. A GPA calculator handles that weighting.
Yes. Negative values, decimals, and mixed lists of positive and negative numbers all parse correctly. The mean can land anywhere on the number line.
Excel’s AVERAGE function does the same thing: it adds the numbers in a range and divides by the count of numeric cells. Pasting the result into this calculator is a quick way to verify the spreadsheet’s output.
The Britannica entry on mean, median, and mode defines the arithmetic mean as the sum of a set of numbers divided by the count and contrasts it with the median and mode.
The NIST/SEMATECH e-Handbook of Statistical Methods provides the technical definition of the sample mean and its role in exploratory data analysis.
Khan Academy’s review of mean, median, and mode explains the calculation of each measure of center and when each is useful.
Median calculator – runs the sorted-middle calculation so you can compare it with the mean.
GPA calculator – handles the credit-hour weighting that a plain arithmetic mean ignores.
This calculator is an educational and utility tool. It performs the arithmetic mean calculation described on this page and reports supporting statistics, but it does not provide statistical consulting, financial advice, medical advice, or any other professional service. If you’re using an average to make a decision that carries financial, health, or safety consequences, confirm the result with a qualified professional who can review the data and its assumptions.
ADVERTISEMENT
ADVERTISEMENT