
Find the mean, median, and mode of any list of numbers in one pass. Includes quartiles, interquartile range, a frequency table, and a complete step-by-step breakdown.
| Quantity | Value | Formula | Notes |
|---|
| Position | Sorted value | Frequency | Deviation (x − x̄) | Note |
|---|
| Value | Frequency | Percentage | Cumulative % | Note |
|---|
| Metric | Value | Notes |
|---|
-
Select a citation style above. Click the citation text to select it all, then copy.
ADVERTISEMENT

Founder & CEO, Toolraxy
Faiq Ur Rahman is a web designer, digital product developer, and founder of Toolraxy, a growing platform of web-based calculators and utility tools. He specializes in building structured, user-friendly tools focused on health, finance, productivity, and everyday problem-solving.
User Ratings:
ADVERTISEMENT
ADVERTISEMENT
The mean is the sum of all values divided by the count. The median is the middle value after sorting. The mode is the most frequent value. Together they form the three standard measures of central tendency, defined by the National Institute of Standards and Technology as different ways to estimate a location parameter for a distribution.
Each measure answers a slightly different question. The mean uses every value and gives the arithmetic center, but a single extreme number can pull it away from the rest. The median only cares about position, so it stays near the middle even when the tails are long. The mode identifies the most common value, which is the only measure that works on categories and labels. Statisticians watch the gap between the mean and the median as a quick skewness diagnostic: when the mean sits above the median, the right tail is heavier, and when it sits below, the left tail is heavier. That relationship is the basis of Pearson’s second skewness coefficient, which uses three times the mean-median difference divided by the standard deviation. If you only need one of the three measures, the dedicated median calculator or a separate mean tool can isolate it.
Compute each measure separately from the same sorted list: the mean from the sum and count, the median from the middle position, and the mode from the frequency counts. The calculator does all three in one pass and highlights the median and mode rows in the step-by-step table.
Paste or type your numbers into the data set box. Commas, spaces, semicolons, and new lines all separate values.
Check the “Values detected” field against the count you expected. A mismatch usually means a stray character or a double separator.
Set the decimal places for the display, from zero to six. The default is two.
Read the three headline values at the top: mean, median, and mode. If the data has no mode, the mode slot says “None.”
Check the shape label in the context line. It tells you whether the mean is above the median (right-skewed), below it (left-skewed), or level with it (symmetric).
Open the frequency table to see each distinct value, its count, its percentage, and the cumulative percentage. The median and mode rows are highlighted.
Scan the calculation breakdown for quartiles, IQR, range, and the sum of deviations, which should land at zero for a correct mean.
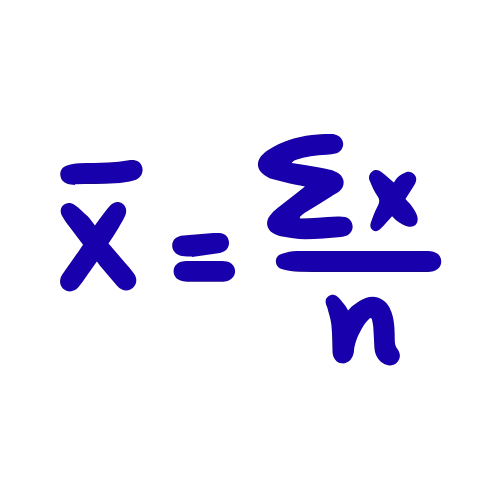
The three measures use different formulas on the same sorted data: the mean is Σx ÷ n, the median is the middle position, and the mode is the value with the highest frequency. Quartiles split the sorted list into halves, and the IQR is Q3 minus Q1.
Formula (median): odd n → sorted[(n + 1) ÷ 2]; even n → average the two middle values

Formula (mode):   value(s) x where f(x) = max frequency

Formula (IQR):    IQR = Q3 − Q1
The calculator sorts the values once, then runs all three measures from that sorted list. The mean uses the original values, the median uses the sorted positions, and the mode uses the frequency map. Quartiles follow the exclusive method: Q1 is the median of the values below the median, and Q3 is the median of the values above it, with the median excluded when the count is odd. The Scribbr guide to interquartile range notes that the exclusive method is common for even-count data and produces a wider IQR than the inclusive method because it uses more of the middle values. The shape label compares the mean and median directly: if the mean is greater than the median, the data is right-skewed; if it is less, the data is left-skewed; if they are equal, the data is symmetric. That relationship follows the Pearson skewness convention, where mean > median > mode for a right-skewed distribution and mean < median < mode for a left-skewed one.
A small firm reports eight annual salaries: $38,000, $42,000, $45,000, $47,000, $50,000, $52,000, $58,000, and $310,000. The sum is $642,000, so the mean is $80,250. The median, between the fourth and fifth sorted values ($47,000 and $50,000), is $48,500. No value repeats, so there is no mode.
The gap between the mean and the median is $31,750, and the shape label reads right-skewed. That is the owner’s $310,000 salary pulling the mean upward while the median stays near what a typical employee earns. The range runs from $38,000 to $310,000, a spread of $272,000, but the interquartile range is only $11,000, from $42,750 to $53,750. The middle half of the salaries sits in a tight band; the tails carry the spread. If you remove the owner’s salary, the mean drops to $47,428 and the median barely moves to $47,000. That comparison is the practical argument for reporting the median when the data is skewed. The Joint Economic Committee’s report on income distribution uses the same reasoning: a single extreme salary can push the mean far from the rest, making the median a better indicator of central tendency.
A mean median mode calculator tells you where the center sits, how the values cluster, and whether the center is being distorted. That combination feeds decisions about which average to report, whether the data has outliers, and how spread out the middle half really is.
Choosing which average to report. A salary summary that reports only the mean can overstate what a typical employee earns when one executive salary sits far above the rest. The median gives the fairer center, and the shape label tells you when to switch.
Spotting outliers and skew. A large mean-median gap is a skewness flag. Before you hunt for the outlier manually, the gap tells you whether the distortion is on the high side or the low side.
Understanding spread beyond the range. The range is sensitive to one extreme value. The IQR tells you how tightly the middle 50% clusters, which is often more useful than the full spread.
Comparing two data sets fairly. If one group has a higher mean but the same median as another, the difference may sit entirely in the tail. The three measures together show where the groups diverge.
Checking a frequency pattern. The mode and the frequency table reveal whether one value dominates or whether the data is spread across many values. That pattern matters for inventory, survey responses, and quality coding.
The mean moves when the total moves or when the count changes. That sounds obvious, but the practical drivers are more specific: an outlier, a parsing error that drops a value, or a count that includes a zero you didn’t notice.
Extreme values pull the mean toward them. A single 200 in a list of scores between 60 and 90 drags the average upward, sometimes by several points.
The count includes every accepted value. A zero counts as a value. If you forget to remove a placeholder zero, the mean drops.
Parsing errors change the count. A token like “12a” gets rejected, which lowers n and changes the divisor. Check the “Values detected” field against your expected count.
Decimal places affect the display, not the calculation. The tool computes at full precision and rounds only what you see. A mean displayed as 82.50 and one displayed as 82.5 are the same number underneath.
Negative values are valid. Temperatures below zero and financial losses belong in the list. They pull the mean down just like any other value below the current average.
The mean of a subset is not the mean of the whole. If you calculate averages for two groups separately and then average those two averages, you’ll get a different number than if you pooled every value. That’s the classic averaging-averages mistake.
Data set size changes stability. A mean from five values can swing hard when one value changes. A mean from five hundred values barely moves.
The mean is the sum divided by the count, the median is the middle value after sorting, and the mode is the most frequent value. The NIST measures of location guide describes all three as different ways to estimate the center of a distribution.
Add the values and divide by the count for the mean, sort and pick the middle for the median, and count frequencies for the mode. The calculator runs all three in one pass and shows the sorted list with the median and mode rows highlighted.
Use the median when the data is skewed or has extreme values. Income, home prices, and wait times are common cases. The Joint Economic Committee’s salary example shows a mean of $181,500 and a median of $50,000 on the same seven salaries because one $1,000,000 salary pulls the mean.
The data is right-skewed, meaning the high tail is heavier. The ScienceDirect section on skewness states that for a positively skewed distribution, mean > median > mode. A few large values are pulling the mean upward.
Yes. If two or more values share the highest frequency, each is a mode. Two modes is bimodal; three or more is multimodal. The calculator labels the type in the results.
Every value appears the same number of times, usually because the data is continuous and no value repeats. Reporting “None” is correct; it means there is no most-frequent value.
The IQR is Q3 minus Q1, the spread of the middle 50% of the data. It ignores the tails, so one extreme value does not inflate it. The Scribbr guide to interquartile range explains that the exclusive method used here produces a wider IQR than the inclusive method.
Sort the data and average the two middle values. For eight values, average the fourth and fifth. The calculator does this automatically and shows the two middle positions in the step-by-step table.
It compares the mean and median. If the mean is higher, the data is right-skewed; if lower, left-skewed; if nearly equal, symmetric. The label is based on the Pearson skewness convention that links the mean-median gap to tail direction.
Yes, in a perfectly symmetric, single-peaked distribution. The NIST measures of location guide notes that for a normal distribution the three measures are equivalent. A visible gap between them is a sign that the data is not symmetric.
Yes. Negative values, decimals, and mixed lists all parse correctly. The mean can be negative, the median can sit below zero, and the mode can be a negative value.
The range is max minus min and uses only the two extreme values. The IQR is Q3 minus Q1 and uses the middle half. The range is sensitive to outliers; the IQR is not.
The National Institute of Standards and Technology’s measures of location guide defines the mean, median, and mode as three common location estimators and explains how skewness pulls the mean away from the median.
The Scribbr guide to interquartile range explains the exclusive and inclusive quartile methods and notes that the exclusive method is common for even-count data.
The ScienceDirect section on skewness and symmetric distributions states the Pearson skewness relationships: mean > median > mode for right-skewed data, mean < median < mode for left-skewed data, and equality for symmetric data.
The Joint Economic Committee’s 2001 report on income distribution provides the seven-salary example where the mean is $181,500, the median is $50,000, and the mode is $40,000, and explains why the median is the better center when outliers are present.
Median calculator – runs the sorted-middle calculation so you can compare it with the mean.
Arithmetic mean calculator – computes the sum-divided-by-count average so you can compare it with the median.
This calculator is an educational and utility tool. It performs the mean, median, mode, quartile, and IQR calculations described on this page, but it does not provide statistical consulting, financial advice, medical advice, or any other professional service. If you are using these measures to make a decision that carries financial, health, or safety consequences, confirm the result with a qualified professional who can review the data and its interpretation.
ADVERTISEMENT
ADVERTISEMENT